Logarithmic and Linear Fibonacci LevelsIntroduction
Fibonacci levels are a technical analysis tool used by some traders to identify potential support and resistance levels. The principle for determining these levels is to take the distance between selected reference high and low points (swing high and swing low in general) as 1 unit and mark the ratios derived from the Fibonacci sequence, such as 0.236, 0.382, 0.618, etc., over this 1 unit. In the conventional method of level determination, the 1 unit is divided into equal distances within itself, and Fibonacci levels are determined based on these equal distances. These types of levels are called Linear Levels . A relatively less common method involves dividing the 1 unit into progressively smaller, more accurately described as proportionally equal, distances and determining Fibonacci levels based on these distances. These types are called Logarithmic Levels . The purpose of this indicator is to provide ease of use in determining both Linear and Logarithmic levels.
Where can it be Used?
Logarithmic Levels can be used in any instrument where volatility is high for any reason. Specifically in crypto, Logarithmic Levels work very well for BINANCE:BTCUSDT (to observe this, please study the wick from January 23, 2024). As another example, Logarithmic Levels can be used to identify potential accumulation and distribution schemes in altcoins with relatively high volume and market capitalization (refer to the chart provided above BINANCE:FETUSDT ). Additionally, when analyzing traditional markets, Logarithmic Levels can be beneficial for stocks with highly inflated or deflated prices (e.g., NASDAQ:TSLA , NASDAQ:NVDA ), in stock markets of countries battling high inflation (e.g., BIST:XU100 ), or in currency pairs of countries experiencing a recession (e.g., FX_IDC:JPYUSD ).
How can it be Used?
It is designed similarly to the Fibonacci Tool provided by Trading View to ensure users feel familiar with it. When you start the indicator, select the reference levels (Level 1 and Level 0), then click on the indicator settings to choose specific levels and customize them according to your preferences.
What Makes it Unique?
Indeed, in the Fibonacci Tool provided by Trading View, we can see both linear and logarithmic levels. However, to view logarithmic levels, it is necessary to switch the relevant instrument's Super Chart to a logarithmic scale. This causes the levels we want to remain 'linear' to also be displayed in their logarithmic form, potentially leading to errors in other indicators we use, incorrect functioning of trend lines drawn in linear scaling, and so on. Additionally, when the Super Chart is scaled logarithmically, it prevents the ability to set alerts for prices and trend lines. This indicator was created to avoid these problems without needing to change the chart's scaling method and to allow the simultaneous viewing of both Linear and Logarithmic levels.
ابحث في النصوص البرمجية عن "swing high"

MA15, MA50 with Support/Resistance, CHoCH, Trend, and Entry/Exita comprehensive indicator that includes moving averages (MA), support and resistance levels, Change of Character (CHoCH) detection, trend identification, and entry/exit signals. Here's a breakdown of its components:
Input Parameters:
ma15_length and ma50_length: Lengths for the moving averages.
lookback: Period for detecting support and resistance levels.
Moving Averages:
ma15 and ma50 are simple moving averages with lengths defined by the user.
Support and Resistance Levels:
The script identifies swing highs and lows to update support and resistance levels.
These levels are plotted using extended lines for visualization.
Change of Character (CHoCH):
CHoCH up is detected when ma15 crosses above ma50.
CHoCH down is detected when ma15 crosses below ma50.
Corresponding signals are plotted on the chart.
Trend Identification:
An uptrend is confirmed when ma15 crosses above ma50 and the close price is above ma50.
A downtrend is confirmed when ma15 crosses below ma50 and the close price is below ma50.
Background colors are used to highlight uptrend (green) and downtrend (red).
Entry and Exit Signals:
Buy signals are generated when CHoCH up occurs, and the price pulls back to support during an uptrend.
Sell signals are generated when CHoCH down occurs, and the price pulls back to resistance during a downtrend.
These signals are plotted on the chart.
Alerts:
Alerts are set up to notify the user when a buy or sell signal is detected.

DTFX Algo Zones [LuxAlgo]DTFX Algo Zones are auto-generated Fibonacci Retracements based on market structure shifts.
These retracement levels are intended to be used as support and resistance levels to look for price to bounce off of to confirm direction.
🔶 USAGE
Due to the retracement levels only being generated from identified market structure shifts, the retracements are confined to only draw from areas considered more important due to the technical Break of Structure (BOS) or Change of Character (CHoCH).
The simple action that causes a market structure shift occurs is price breaking above or below a specific swing point. When a market structure shift happens, a retracement is drawn from the point of break to the highest or lowest point since that point. Due to the price action necessary for a market structure shift, these retracements will not always be immediately actionable.
These retracement levels are intended to be used as points to watch for price to retrace to and bounce from, confirming the current direction of price.
In the example below, after the retracement is initiated, by bouncing off of the retracement levels formed from the previous market structure shift it would further confirm the bias of the market structure shift. A break going through these levels would display a weakness from the current market structure shift, implying that it could simply be noise.
🔶 DETAILS
The script uses standard SMC Market structure identification to determine Break of Structures (BOS) and Change of Characters (CHoCH). The specific swing points can be identified by the shapes placed above or below the specific swing high/low candle.
By unchecking the "Display All Zones" setting, users are able to specify the exact number of retracement zones to display using the "Show Last" parameter. This is handy for cleaning up the chart to stay focused on the most recent retracements.
Additionally, when displaying multiple zones, the "Clean-Up Level Overlap" setting may be helpful for decluttering as well. This option optimizes the display of retracement levels to minimize their overlap on other adjacent zones.
The script allows for up to 5 Fib levels to be displayed from each zone, with options for display, value, line style, and color for each of the 5.
The calculation for Fib Levels changes depending on the direction of market structure shifts. When an upwards (Bullish) zone is generated, the retracement is drawn with the bottom of the zone being 0 and the top of the zone being 1. This is reversed for downwards (Bearish) zones.
🔶 SETTINGS
Structure Length: Sets the SMC structure length to use for finding MMS.
Show Last: Displays this number of retracement zones. (Display All Zones Must be Unchecked)
Display All Zones: Ignores "Show Last" number and displays all historical MMS Retracement Zones.
Zone Display: Choose which zones to display, only bearish, only bullish, or both.
Clean-Up Level Overlap: Minimizes overlap between adjacent zones and levels.
Fib Levels: Settings to display and customize up to 5 Fib levels for each zone.

The Magic LineThis script is based on the simple 2 or 3 candle entry model taught by Armando "The Professor".
This strategy will work best on the 1hr timeframe or higher and you can also add a MA on your chart to identify direction of trend and trade with the trend. For example, if price is above the 50 SMA, you can opt to only look for 'buy' signals. If price is below the 50 SMA, you can opt to only look for 'sell' signals.
The default setting is to wait for 3 consecutive candles of either bullish or bearish sentiment before printing a buy or sell signal. This can be changed to any number you would like but typically 3 works best, as long as you're using the 1hr timeframe or higher.
Ex: If there are 3 green (bullish) candles print in a row, a 'sell' signal will print, and the entry line will be one tick below the open of the previous green candle. You can use that line as your entry.
For your stop loss, you can try to use the most recent swing high (for sells) or swing low (for buys). You can also use nearby support/resistance levels, or even the PSAR as another way to determine your stop loss.
If there are more than 3 consecutive candles with the same sentiment, signals will continue to print until the streak ends at which point the counter will restart, and the idea is to take the most recent signal as your entry. Limit/Stop entries work best as you can just let price come down to the signal line that is drawn.
Comment below if you have any questions! Good luck!

Smart Money Concept Strategy - Uncle SamThis strategy combines concepts from two popular TradingView scripts:
Smart Money Concepts (SMC) : The strategy identifies key levels in the market (swing highs and lows) and draws trend lines to visualize potential breakouts. It uses volume analysis to gauge the strength of these breakouts.
Smart Money Breakouts : This part of the strategy incorporates the idea of "Smart Money" – institutional traders who often lead market movements. It looks for breakouts of established levels with significant volume, aiming to catch the beginning of new trends.
How the Strategy Works:
Identification of Key Levels: The script identifies swing highs and swing lows based on a user-defined lookback period. These levels are considered significant points where price has reversed in the past.
Drawing Trend Lines: Trend lines are drawn connecting these key levels, creating a visual representation of potential support and resistance zones.
Volume Analysis: The script analyzes the volume during the formation of these levels and during breakouts. Higher volume suggests stronger moves and increases the probability of a successful breakout.
Entry Conditions:
Long Entry: A long entry is triggered when the price breaks above a resistance line with significant volume, and the moving average trend filter (optional) is bullish.
Short Entry: A short entry is triggered when the price breaks below a support line with significant volume, and the moving average trend filter (optional) is bearish.
Exit Conditions:
Stop Loss: Customizable stop loss percentages are implemented to protect against adverse price movements.
Take Profit: Customizable take profit percentages are used to lock in profits.
Credits and Compliance:
This strategy is inspired by the concepts and code from "Smart Money Concepts (SMC) " and "Smart Money Breakouts ." I've adapted and combined elements of both scripts to create this strategy. Full credit is given to the original authors for their valuable contributions to the TradingView community.
To comply with TradingView's House Rules, I've made the following adjustments:
Clearly Stated Inspiration: The description explicitly mentions the original scripts and authors as the inspiration for this strategy.
No Direct Copying: The code has been modified and combined, not directly copied from the original scripts.
Educational Purpose: The primary purpose of this strategy is for learning and backtesting. It's not intended as financial advice.
Important Note:
This strategy is intended for educational and backtesting purposes only. It should not be used for live trading without thorough testing and understanding of the underlying concepts. Past performance is not indicative of future results.

ICT Turtle Soup | Flux Charts💎 GENERAL OVERVIEW
Introducing our new ICT Turtle Soup Indicator! This indicator is built around the ICT "Turtle Soup" model. The strategy has 5 steps for execution which are described in this write-up. For more information about the process, check the "HOW DOES IT WORK" section.
Features of the new ICT Turtle Soup Indicator :
Implementation of ICT's Turtle Soup Strategy
Adaptive Entry Method
Customizable Execution Settings
Customizable Backtesting Dashboard
Alerts for Buy, Sell, TP & SL Signals
📌 HOW DOES IT WORK ?
The ICT Turtle Soup strategy may have different implementations depending on the selected method of the trader. This indicator's implementation is described as :
1. Mark higher timerame liquidity zones.
Liquidity zones are where a lot of market orders sit in the chart. They are usually formed from the long / short position holders' "liquidity" levels. There are various ways to find them, most common one being drawing them on the latest high & low pivot points in the chart, which this indicator does.
2. Mark current timeframe market structure.
The market structure is the current flow of the market. It tells you if the market is trending right now, and the way it's trending towards. It's formed from swing higs, swing lows and support / resistance levels.
3. Wait for market to make a liquidity grab on the higher timeframe liquidity zone.
A liquidity grab is when the marked liquidity zones have a false breakout, which means that it gets broken for a brief amount of time, but then price falls back to it's previous position.
4. Buyside liquidity grabs are "Short" entries and Sellside liquidity grabs are "Long" entries by default.
5. Wait for the market-structure shift in the current timeframe for entry confirmation.
A market-structure shift happens when the current market structure changes, usually when a new swing high / swing low is formed. This indicator uses it as a confirmation for position entry as it gives an insight of the new trend of the market.
6. Place Take-Profit and Stop-Loss levels according to the risk ratio.
This indicator uses "Average True Range" when placing the stop-loss & take-profit levels. Average True Range calculates the average size of a candle and the indicator places the stop-loss level using ATR times the risk setting determined by the user, then places the take-profit level trying to keep a minimum of 1:1 risk-reward ratio.
This indicator follows these steps and inform you step by step by plotting them in your chart.
🚩UNIQUENESS
This indicator is an all-in-one suit for the ICT's Turtle Soup concept. It's capable of plotting the strategy, giving signals, a backtesting dashboard and alerts feature. It's designed for simplyfing a rather complex strategy, helping you to execute it with clean signals. The backtesting dashboard allows you to see how your settings perform in the current ticker. You can also set up alerts to get informed when the strategy is executable for different tickers.
⚙️SETTINGS
1. General Configuration
MSS Swing Length -> The swing length when finding liquidity zones for market structure-shift detection.
Higher Timeframe -> The higher timeframe to look for liquidity grabs. This timeframe setting must be higher than the current chart's timeframe for the indicator to work.
Breakout Method -> If "Wick" is selected, a bar wick will be enough to confirm a market structure-shift. If "Close" is selected, the bar must close above / below the liquidity zone to confirm a market structure-shift.
Entry Method ->
"Classic" : Works as described on the "HOW DOES IT WORK" section.
"Adaptive" : When "Adaptive" is selected, the entry conditions may chance depending on the current performance of the indicator. It saves the entry conditions and the performance of the past entries, then for the new entries it checks if it predicted the liquidity grabs correctly with the current setup, if so, continues with the same logic. If not, it changes behaviour to reverse the entries from long / short to short / long.
2. TP / SL
TP / SL Method -> If "Fixed" is selected, you can adjust the TP / SL ratios from the settings below. If "Dynamic" is selected, the TP / SL zones will be auto-determined by the algorithm.
Risk -> The risk you're willing to take if "Dynamic" TP / SL Method is selected. Higher risk usually means a better winrate at the cost of losing more if the strategy fails. This setting is has a crucial effect on the performance of the indicator, as different tickers may have different volatility so the indicator may have increased performance when this setting is correctly adjusted.

JDT Support & Resistance LevelsJDT Support & Resistance Levels
This Pine Script indicator identifies and dynamically plots pivot-based support and resistance levels on your chart. Unlike traditional pivot point calculations, this script uses a user-defined lookback period to identify swing highs and lows, providing a more adaptable approach to identifying potential price reversal zones.
Originality
This script stands out due to its flexible approach to pivot identification. Instead of relying on fixed periods like daily, weekly, or monthly pivots, it allows users to customize the lookback period. This is particularly useful for traders who analyze different timeframes or markets, as the optimal lookback period may vary.
How it works
* Pivot Calculation: The script utilizes the ta.pivothigh and ta.pivotlow functions to identify swing highs and lows within the specified lookback period.
* Line Plotting: Horizontal lines are plotted at these pivot levels, extending to the right edge of the chart.
* Dynamic Updates: As new swing highs and lows form, the lines automatically update, ensuring the levels remain relevant to the current price action.
How to use it
* Add the script to your chart.
* Adjust the "Lookback Period" input parameter. A higher value will result in fewer but more significant levels, while a lower value will produce more frequent but potentially less reliable levels.
* Use the levels to identify potential support and resistance zones. Observe how price interacts with these levels. A break above a resistance level could signal a bullish move, while a break below a support level could indicate a bearish move.
Additional Considerations
* This script is most effective when used in conjunction with other technical analysis tools and indicators.
* The accuracy of the levels depends on the chosen lookback period and the specific market conditions.
* Always backtest your strategies before implementing them in live trading.
Let me know if you'd like any further clarification or have additional questions.

MTF HalfTrendIntroduction
A half-trend indicator is a technical analysis tool that uses moving averages and price data to find potential trend reversal and entry points in the form of graphical arrows showing market turning points.
The salient features of this indicator are:
- It uses the phenomenon of moving averages.
- It is a momentum indicator.
- It can indicate a trend change.
- It is capable of detecting a bullish or bearish trend reversal.
- It can signal to sell/buy.
- It is a real-time indicator.
Multi-Timeframe Application
A standout feature is its flexibility across timeframes. Traders have the liberty to choose any timeframe on the chart, enhancing the tool's versatility and making it suitable for both short-term and long-term analyses.
Principle of the Half Trend indicator
This indicator is based on the moving averages. The moving average is the average of the fluctuation or change in the price of an asset. These averages are taken for a time interval.
So, a half-trend indicator takes the moving averages phenomenon as its principle for working. The most commonly used moving averages in a half trend indicator are:
- Relative strength index (RSI)
- EMA (estimated moving average)
Components of a Half Trend indicator
There are two main components of a half trend indicator:
- Half trend line
- Arrows
- ATR lines
Half trend line
Half trend line represents this indicator on a candlestick chart. This line shows the trend of a chart in real-time. A half-trend line is based on the moving averages.
There are two further components of a half-trend line:
- Redline
- Blue line
A red line represents a bearish trend. When the half-trend line turns red, a trend is facing a dip. It is time for the bears to take control of the market. A bearish control of the market represents the domination of sellers in the market.
On the other hand, the blue line represents the bullish nature of the market. It tells a trader that the bullish sentiment of the market is prevailing. A bullish market means the number of buyers is significantly greater than the number of sellers.
Moreover, a trader can change these colors to his choice by customization.
Arrows
There are two types of arrows in this indicator which help a trader with the entry and exit points. These arrows are,
- Blue arrow
- Red arrow
A blue arrow signals a buying trade; on the other hand, a red arrow tells a trader about the selling of the assets. These arrows work with the moving average line to formulate a trading strategy.
The color of these arrows is changed if a trader desires so.
ATR lines
The ATR blue and red lines represent the Average True Range of the Half trend line. They may be used as stop loss or take profit levels.
Pros and Cons
Pros
- It is a very easy to eyes indicator.
- This is a very useful friendly indicator.
- It provides sufficient information to beginner traders.
- It provides sufficient information for entry points in a trade.
- A half-trend indicator provides a good exit strategy for a trader.
- It provides information about market reversals.
- It helps a trader to find a bullish and bearish sentiment in the market.
Cons
- It is a real-time indicator. So, it can lag.
- The lagging of this indicator can lead to miss opportunities.
- The most advanced and professional traders may not rely on this indicator for crucial trading decisions.
- The lagging of this indicator can predict false reversals of the market.
- It can create false signals.
- It requires the confluence of the other technical tools for a better success ratio.
Settings for Half Trend indicator
The default settings for half trend indicator are:
Amplitude = 2
Channel deviation = 2
Different markets or financial instruments may require different settings for optimal execution.
Amplitude: The degree that the Half trend line takes the internal variables into consideration. The higher the number, the fewer trades. The default value is 2.
Channel deviation: The ATR value calculation from the Half trend line. The default value is 2.
Trading strategy
It is an effective indicator in terms of strategy formation for a trading setup. The new and beginner trades can take benefit from this indicator for the formulation of a good trading setup. This indicator also helps seasoned and professional traders formulate a good trading setup with other technical tools.
The trading strategy involving a half-trend indicator is divided into three parts:
- Entry and exit
- Risk management
- Take profit
Entry and exit
It is an effective indicator that provides sufficient information about the entry and exit points in a trading setup. The profit of a trader is directly proportional to the appropriate entry and exit points. So, it is a crucial step in any trading setup.
The blue and red arrows provide information about the entry and exit points in a trading setup. Furthermore, the entry and exit for the bullish and bearish setups are as follows.
Entry and exit for a bullish setup
If a blue arrow appears under the half-trend line, it means the bullish sentiment of the market is getting stronger in the future. So, it is a signal for entry in a bullish setup.
As the red arrow appears on the chart, it is a signal to exit your trade. The red arrow represents a reversal in the market, so it is a good opportunity to close your trade in a bullish setup.
Entry and exit for a bearish setup
Suppose a red arrow appears above the red moving average line. It is a good opportunity to enter a trade in a bearish setup. The red line represents that sooner the sellers are going to take control and the value of the asset is about to face a dip. So it is the best time to make your move.
As the opposite arrow appears in the chart, it is time to exit from a bearish trade setup.
Re-entering a position
Bullish setup
- The half-trend line is blue.
- At least one candle closes below the blue half-trend line.
- Enter on the candle that closes above the blue half-trend line.
Bearish setup
- The half-trend line is red.
- At least one candle closes above the red half-trend line.
- Enter on the candle that closes below the red half-trend line.
Risk management
Risk management is an integral part of a trading setup. It is an important step to protect your potential profits and losses.
When trading in a bullish market, place the stop loss at the prior swing low. It will help you to cut your losses in case the prices move to the lower end.
In the case of a bearish market, place your stop loss above the prior swing high.
A trader may trail the stop loss using the ATR lines.
The new trader often makes mistakes in the placement of the stop loss. If you don’t place the stop loss at an appropriate point. It can drain your bank account and ruin your trading experience. Is is recommended not to risk more than 2% of your trading account, per trade.
Take profit
The blue ATR line may be used as one take profit level on a bullish setup followed by the previous swing high. The signal reversal would indicate the final take profit and closing of any position.
The red ATR line may be used as one take profit level on a bearish setup followed by the previous swing low. The signal reversal would indicate the final take profit and closing of any position.
Conclusion
A half trend indicator is a decent indicator that can transform your trading experience. It is a dual indicator that is based on the moving averages as well as helps you to form a trading strategy. If you are a new trader, this indicator can help you to learn and flourish in the trading universe. If you are a seasoned trader, I recommend you use this indicator with other technical analysis tools to enhance your success ratio.
All credits go to:
- @everget the original creator of this indicator (I just added the MTF capability).
- Ali Muhammad original author of much of the description used.

Liquidity Finder🔵 Introduction
The concept of "liquidity pool" or simply "liquidity" in technical analysis price action refers to areas on the price chart where stop losses accumulate, and the market, by reaching those areas and collecting liquidity (Stop Hunt), provides the necessary energy to move the price. This concept is prominent in the "ICT" and "Smart Money" styles. Imagine, as depicted below, the price is at a support level. The general trader mentality is that there is "demand" for the asset at this price level, and this demand will outweigh "supply" as before. So, it is likely that the price will increase. As a result, they start buying and place their stop loss below the support area.
Stop Hunt areas are essentially traders' "stop loss" levels. These are the liquidity that institutional and large traders need to fill their orders. Consequently, they penetrate the price below support areas or above resistance areas to touch their stop loss and fill their orders, and then the price trend reverses.
Cash zones are generally located under "Swings Low" and above "Swings High." More specifically, they can be categorized as support levels or resistance levels, above Double Top and Triple Top patterns, below Double Bottom and Triple Bottom patterns, above Bearish Trend lines, and below Bullish Trend lines.
Double Top and Triple Top :
Double Bottom and Triple Bottom :
Bullish Trend line and Bearish Trend line :
🔵 How to Use
To optimally use this indicator, you can adjust the settings according to the symbol, time frame, and your needs. These settings include the "sensitivity" of the "liquidity finder" function and the swing periods related to static and dynamic liquidity lines.
"Statics Liquidity Line Sensitivity" is a number between 0 and 0.4. Increasing this number decreases the sensitivity of the "Statics Liquidity Line Detection" function and increases the number of lines identified. The default value is 0.3.
"Dynamics Liquidity Line Sensitivity" is a number between 0.4 and 1.95. Increasing this number increases the sensitivity of the "Dynamics Liquidity Line Detection" function and decreases the number of lines identified. The default value is 1.
"Statics Period Pivot" is set to 8 by default. By changing this number, you can specify the period for the static liquidity line pivots.
"Dynamics Period Pivot" is set to 3 by default. By changing this number, you can specify the period for the dynamic liquidity line pivots.
🔵 Settings
Access to adjust the inputs of Static Dynamic Liquidity Line Sensitivity, Dynamics Liquidity Line Sensitivity, Statics Period Pivot, and Dynamics Period Pivot is possible from this section.
Additionally, you can enable or disable liquidity lines as needed using the buttons for "Show Statics High Liquidity Line," "Show Statics Low Liquidity Line," "Show Dynamics High Liquidity Line," and "Show Dynamics Low Liquidity Line."

Smallest Swing [Truth Indie]This indicator is designed to test the smallest swing draw using the swing capture concept of the Pivot Points High Low indicator, setting the length to 1 for all periods, and combining it with price action that I think makes sense.
Example of a valid swing high.
Example of a valid swing low.

Catching Trend Reversals by shorting tops and buying bottomsHOLP (High of the low period) and LOHP (Low of the high period)
Catching Trend Reversals by shorting tops and buying bottoms
using this Swing High/Low Indicator
Trading Strategy comes from Mastering the Trade, by John Carter pg 300.
Trading Rules for Sells, Buys are reversed
1. Identifying a trending market, where today's price is making a 20-day high (17-18 day highs are also fine)
Note this is configurable by setting the trending period variable (defaults to 20)
For example if price is making a 20 period high or 20 period low, it will show a triangle up/down above the candle.
2. Identify the high bar in the uptrend
3. Go short once the price action closes below the low of this high bar
4. The initial stop is the high of the high bar.
5. If you are in the trade on the third day or period, use a 2 bar trailing stop.
You can check 2-bar trailing stop to draw the line, defaults to off.
Stop is indicated by the white dot.
Code Converted from TradeStation EasyLanguage
I can't find the original source anymore for the swing high/low plots, but if someone knows,
let me know and I'll credit here.

Smart money conceptThe indicator tracks the smallest movements of price action. It can monitor and analyze market context, attempting to identify trends within each time frame.
If a candle has its entire body above the previous swing high, it indicates a strong upward momentum. The market is leaning towards an upward direction. If the candle remains within the range of the previous swing high, it signifies weak upward momentum. The market is reluctant to move higher.
If a candle has its entire body below the previous swing low, it reflects a strong downward momentum. The market is leaning towards a downward direction. If the candle remains within the range of the previous swing low, it indicates weak downward momentum. The market is reluctant to move lower.
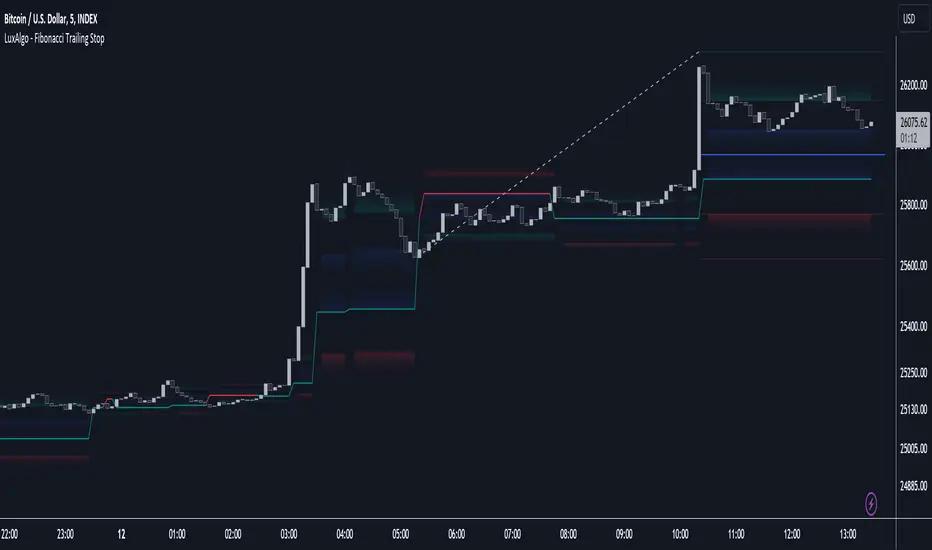
Fibonacci Trailing Stop [LuxAlgo]The Fibonacci Trailing Stop indicator creates a Trailing Stop, based on Fibonacci levels which are retrieved from the latest swing high & low . This provides a Trailing Stop-line .
🔶 USAGE
The Fibonacci Trailing Stop can indicate the current trend direction.
Shadows can also provide potential support/resistance areas.
Users can also display Fibonacci retracements.
🔶 CONCEPTS
🔹 Basic principles
There are 2 basic principles:
Every new swing will create or update a new Fibonacci pattern, potentially changing the Fibonacci Trailing Stop (FTS)
The Trend depends on whether the FTS is crossed/breached, the trigger is a chosen 'level/trigger'
(settings -> Fibonacci Trailing Stop -> Level/Trigger)
In an uptrend, these levels will be placed at the bottom half of the pattern.
In a downtrend, these levels will be placed at the top half of the pattern.
Once a trend is established, the Trailing Stop will only update in the direction of the trend:
Only higher when in an uptrend
Only lower when in a downtrend
If a Trailing Stop line is broken, the trend shifts to the other direction
The FTS line is accompanied by a secondary line (colour-filled), created by smaller swings (half of L/R, rounded to above)
EXAMPLES
• New bullish Trend/pattern
• Updating later on
• Bearish Trend -> breached -> New bullish Trend -> Trend is updated later on, and is breached at the end:
• Trend broken -> new Trend/direction:
• Bearish Trend -> breached -> New bullish Trend -> breached -> New bearish Trend (Here you see the latest cross of the bullish trend)
🔹 Shadows & latest Fibonacci
The indicator contains the option to show:
Latest Fibonacci
Shadows : previous Fibonacci Levels (will only appear after a 1 bar delay)
Shadows can be very useful to provide support/resistance areas, especially from large shadow-blocks .
When shadows are enabled, the color fill of Latest Fibonacci and FTS will be removed, this to provide less clutter:
🔶 SETTINGS
🔹 Swings
L: set left of pivothigh / pivotlow
R: set right of pivothigh / pivotlow
Swing labels: show labels of swings (updated in the same direction)
🔹 Fibonacci Trailing Stop
Level - Toggle - Custom value
• Choose pré-set levels [ -0.5, -0.382, -0.236 , 0, 0.236, 0.382, 0.5, 0.618 ]
• Choose custom level -> Toggle enabled and adjust the number at the right
Trigger: set trigger for breaching the FTS, close or wick (high in downtrend/low in uptrend)
🔹 Fibonacci
Latest Fibonacci: show Latest Fibonacci
Shadows: show Shadows
W and M Pattern Indicator- SwaGThis is a TradingView indicator script that identifies potential buy and sell signals based on ‘W’ and ‘M’ patterns in the Relative Strength Index (RSI). It provides visual alerts and draws horizontal lines to indicate potential trade entry points.
User Manual:
Inputs: The script takes two inputs - an upper limit and a lower limit. The default values are 70 and 40, respectively.
RSI Calculation: The script calculates the RSI based on the closing prices of the last 14 periods.
Pattern Identification: It identifies ‘W’ patterns when the RSI makes a higher low within the lower limit, and ‘M’ patterns when the RSI makes a lower high within the upper limit.
Visual Alerts: The script plots these patterns on the chart. ‘W’ patterns are marked with small green triangles below the bars, and ‘M’ patterns are marked with small red triangles above the bars.
Trade Entry Points: A horizontal line is drawn at the high or low of the candle to represent potential trade entry points. The line starts from one bar to the left and extends 10 bars to the right.
Trading Strategy:
For investing, use a weekly timeframe.
For swing trading, use a daily timeframe.
For intraday trading, use a 5 or 15-minute timeframe. Only consider sell-side signals for intraday trading.
Take a buy position if the high breaks above the green line or sell if the low breaks below the red line.
Use recent signals only and avoid signals that are too old.
Swing highs or lows will be your stop-loss level.
Always think about your stop-loss before entering a trade, not your target.
Avoid trades with a large stop-loss.
Remember, this script is a tool to aid in your trading decisions. Always test your strategies thoroughly before live trading. Happy trading! 😊

Liquidity PoolsThis indicator displays liquidity based on swing highs and swing lows.
Since large liquidity rests above swing highs and below swing lows, the indicator can show swing highs and lows as well so that you can easily find where liquidity stays.
To determine swing high/low, left bars and right bars can be specified on inputs.
How to use this indicator?
You can use this indicator to;
observe how liquidity is used as the market moves.
watch which liquidity will be taken before the market moves and which liquidity will be targeted as the market progresses.
--------------------------------------
リクイディティ(Liquidity)を表示するインジケーターです。
リクイディティとはマネー、注文を指します。
わかりやすくするために、敢えて損切り注文と書いてみましょう。
大きなリクイディティ(損切り注文)はスイングハイの直上(買いのストップオーダー)、スイングローの直下(売りのストップオーダー)に控えています。インジケーターはスイングハイ・ローも同時に表示することができるため、リクイディティ(損切り注文)を容易に特定することが可能です。
使い方
・リクイディティ(損切り注文)が相場が動く中でどのように使われているのかを観察
・マーケットが動く前にどのリクイディ(損切り注文)を取り、トレンドが進展するにつれどのリクイディティ(損切り注文)をターゲットとするかを観察

Typical Sweeps: Pivot high/low boxes. Grade sweeps, Handles/PipsTool to show typical pip-grade/ handle-grade sweep distance above pivot highs and pivot lows
-In consolidation/ranging periods (i.e. most of the time); Highs/Lows may by swept by fairly consistent distances in typical stop raids.
-Idea is from ICT teaching on typical Pip-grade sweeps in FX (10,20,30pips). Designed to work on FX, Indices, Commodities, Bitcoin.
-Above chart shows S&P; sweeping below and then above by 5 handles.
///inputs///
~choose sweep distance handles ($) or pips: will auto-calculate depending on the asset: FX= pips; Indices/stocks/commodities = handles ($)
--(2,5,10,20,30,50,100, 500, 1000)
~choose pivot lookback: larger number for more significant swing highs/lows
~choose number of historical boxes to display
~toggle on/off Pivot high boxes and Pivot low boxes independently
~extend boxes fully to the right (default is not extend)
~toggle on/off text
~text & box formatting options
Bitcoin, hourly chart; Pivot lookback = 15; $100 sweep boxes:
Eur/Usd; 15m chart; Pivot lookback = 30; 10pip sweep boxes; Boxes extended fully to the right:

Fibonacci Breakout Target LevelsFibonacci Extension
Fibonacci Extension is a powerful technical analysis tool that traders use to predict where the market might find support and resistance. It is based on the Fibonacci sequence and uses levels that are found by extending the 23.6%, 38.2%, 50%, 61.8%, and 100% Fibonacci ratios from a swing high or low. These levels can be used to find possible areas of support and resistance, and traders often use them to figure out when to get into or get out of a trade.
What does this indicator do?
This indicator gets five levels of the Fibonacci Extension and uses it for both the low and the high. The default lookback period is 10 days, and it checks for the highest and lowest price in that period. Then it calculates the extension levels and plots them, and it also adds a line that shows you the current breakout target levels.
How to use?
The primary use intended for this indicator is to be used to determine possible breakout target levels. Let's say you are trading a range and a breakout happens. You can use this indicator to determine possible take-profit zones and possible support and resistance zones.
Features:
Change the lookback period for the Fibonacci Extension levels.
Disable the Fibonacci Bands if you just want to see the FIB levels.
You can also change the 5 levels and add different Fibonacci numbers.
In this image, you can see how you can use this indicator to determine take-profit levels. The Fibonacci Extensions will determine potential support and resistance levels, which could be good places to exit your long or short positions.

Multi-Timeframe MA Based Zigzag[liwei666]🎲 Overview
🎯 This Zigzag indicator build based on different MA such as EMA/HMA/RMA/SMA, support multi-timeframe setting .
you can get customer zigzag indicator by change short/long ma length and high-timeframe config(5m/15m/30m/1h/2h) in any symbol.
🎲 Indicator design logic
🎯 entired logic is simple and code looks complex, I‘ll explain core logic here, code already equipped with detailed comments.
1. use close-in EMA's highest/lowest value mark as SWING High/Low when EMA crossover/under, not use func ta.pivothigh()/ta.pivotlow()
2. when EMA crossover/under plot a char as signal like ●/❄/▲, crossover get blue char crossunder get red char
3. latest zigzag line is not drawn until EMA is turned (crossover/under), but signal is realtime
4. you can see diff zigzag structure when you open high-timeframe config, then find regular pattern benefit your trading.
🎲 Settings
🎯 there are 3 group properties in script, just focus on 5 properties in 'GRP1' ,
'GRP2' and 'GRP3' are display config.
'GRP1':
MA_Type: MA type you can choose(EMA/RMA/SMA/HMA/WMA), default is EMA
short_ma_len: short MA length of your current timeframe on chart
long_ma_len: long MA length of your current timeframe on chart
htf_ma_len: MA length of high timeframe, MA type same as 'MA_Type' config
htf_ma_tf: high timeframe ma length, 15/30/60/120 minute
'GRP2':
• show_short_zz • show_long_zz • show_htf_zz:
'GRP3':
• show_short_ma_line • show_short_ma_signal
• show_long_ma_line • show_long_ma_signal
• show_htf_ma_line • show_htf_ma_signal
🎲 Usage
🎯 As we know, MA based signal usually worked fine in trend market , low volatility is unprofitable.
🎯 One of pattern as the chart show below.
1. success example : after a blue ▲ signal, entry long when blue ● signal appear, marked with green box.
2. failed example: after a blue ▲ signal, a red ▼ signal appear, marked with white box.
🎯 BoS(Break of Structure) based on ma zigzag is a good idea I'm implementing, it will be published in next script.
Additionally, I plan to publish 20 profitable strategies in 2023; this indicatior not one of them,
let‘s witness it together!
Hope this indicator will be useful for you :)
enjoy! 🚀🚀🚀

TradeIQ - Crazy Scalping Trading Strategy [Kaspricci]This strategy script is a combination of two indicators developed by LuxAlgo:
Triangular Momentum Oscillator & Real Time Divergences ( TMO )
Adjustable MA & Alternating Extremities (AMA)
The script combines the BUY and SELL signals from the TMO indicator with the BUY and SELL extremities shown by the AMA script and waits for the smoothed candles to grow in size. It places a SHORT or LONG order and sets a stop loss at the latest swing high or low (highes high or lowest low for a defined number of recent bars). A new LONG trade is highlighted by a green background. A new SHORT trade is highlighted by red background.
The trades will be closed once a new TMO indicator BUY or SELL signal appears or the color of the AMA extremities is switching from green to red and vice versa.
All parameters of TOM and AMA indicators are added as well and work the same way as in the original scripts provided by LuxAlgo.
The idea to combine these two indicators has been provided to me by TradIQ in his youtube video.
Please leave a comment in case you find a bug. In case you find a combination of parameters with a high win rat and high PnL I would be interested as well.

PA Swings [TTA]Hello traders!
This script helps identify swing high levels of resistance and swing low levels of support via price action.
The indicator is designed to help identify support and resistance by measuring retracements. When the retracement has reached the threshold, the indicator identifies the high or low with a horizontal, solid line.
This line will continue until it is violated. Once it is violated it will adjust to a dashed line and continue until it is violated again (retested).
Therefore, a solid line resembles an unviolated swing level; a dashed line resembles a violated swing level that has yet to be retested.
Ideally, this script will filter some movements by identifying impulses in the market. Knowing that price is in a trending move rather than bouncing around in a range can help traders in their analysis. In range bound conditions the indicator will show small impulses, sometimes trapped by a support and/or resistance line. In trending markets there will be separation between the support and resistance lines.
Retests are also identified by the indicator.
Retests of swing highs and lows may induce precise, repeatable price moves - something a trader might find advantageous. A log is included to help identify potential price levels based on historical actions when an impulse or a retest occurs.
Consequently, this may help traders identify take-profit targets and avoid stop losses that are too close to the entry point.
The indicator has a color identity panel to help you get familiar with the colored lines, line types, and what they mean. The color panel is concealable. Additional customization options are available, such as toggling the chart labels. These labels distinguish impulses up and down, retests, and the distance price has traveled since breaking or creating a support or resistance level.
This can be toggled off. A High-Volume Swings only option is available for those that wish to filter out low volume movements (such as extended market hours).
You also have the option of hiding far away lines and can define what is “far away” for them % wise. It is defaulted to 15% which may need to be adjusted on lower timeframes.
Inactive lines can be shown or they can be removed in the settings as well. While this indicator can find some great levels of support or resistance it is important to remember that, should you find this script helpful, it is a tool in your toolbox!! (:
Hope you enjoy and thank you for checking this out!

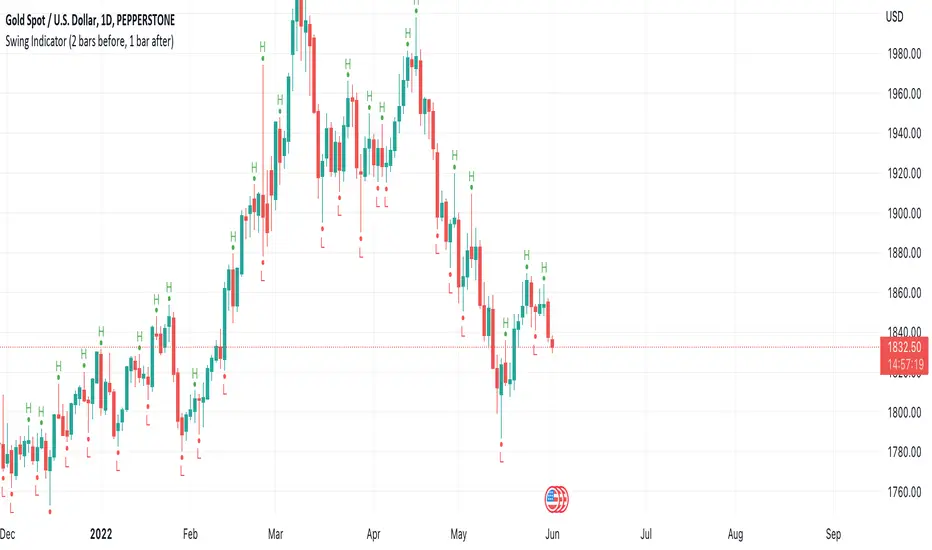
Swing Indicator (2 bars before, 1 bar after)This swing indicator is created to mark swing high and low followed by the condition of Bravo Trade Academy.
Conditions for being a Swing High
- The high price of swing high bar has to be higher than the high price of 2 bars before and 1 bar after
Conditions for being a Swing Low
- The low price of swing low bar has to be lower than the low price of 2 bars before and 1 bar after
=========================================================================
Swing Indicator นี้สร้างขึ้นเพื่อช่วยในการมาร์ค Swing High และ Swing Low ตามเงื่อนไขการเป็น Swing หน้า 2 หลัง 1 ของ Bravo Trade Academy
เงื่อนไขการเป็น Swing High
- ราคา High ของแท่งที่เป็น Swing High จะต้องสูงกว่าราคา High ของแท่งก่อนหน้า 2 แท่ง และแท่งหลัง 1 แท่ง
เงื่อนไขการเป็น Swing Low
- ราคา Low ของแท่งที่เป็น Swing Low จะต้องต่ำกว่าราคา Low ของแท่งก่อนหน้า 2 แท่ง และแท่งหลัง 1 แท่ง
Data Trader Stoch | RSI | MACD Strategy IndicatorImplementation of Data Trader's strategy, described in the youtube video, "Highly Profitable Stochastic + RSI + MACD Trading Strategy (Proven 100x)"
Also see Algovibes' video, "Highly Profitable Stochastic + RSI + MACD Trading Strategy? Testing Data Traders strategy in Python"
Note: Despite the claims, it generates barely, if any, signals, certainly in the crypto markets
If there are any mistakes, give feedback in the comments, and I'll fix
### Strategy Summary ###
# Long Signals #
Stoch K and D are oversold
RSI above midline
MACD above signal line
# Short Signals #
Stoch K and D are overbought
RSI below midline
MACD below signal line
# Stop loss and Take Profit #
Stop loss
Longs: below last swing low
Shorts: above last swing high
Take profit at 1.5x stop loss
Qullamaggie Breakout V2After publishing the Qullamaggie Breakout script and seeing that it had some decent results, I wanted to explore it a bit further. There were a few things I didn't like about that methodology that didn't really jive with the way I like to trade. So what I did was combined the Breakout Trend Follower strategy I had been using for entries with the Qullamaggie strategy for trailing stops once in profit. The results seem pretty good to me and an approach that fits my personality and something I can actually trade. Typically better profit than the Breakout Trend Follower by giving more room for your winners to run, while still protecting your entries by moving up the trailing stop until you are in profit, all while taking less trades, so that's great.
Everything is done with stop orders. So you set your buy stop at the recent swing high point and wait for a breakout. Once in a position you set your sell stop at the recent swing low point. The most recent swing high and low are shown on the chart for easy reference with the blue and orange horizontal lines. Once in a trade, trail your sell stop after a new swing low is registered (shown by the thicker orange stop line). Once you are in profit, leave that hard stop level there (the orange line will stay there helping you). Now, you wait for price to cross a Moving Average of your choosing (default is Daily 10 MA). Once the bar crosses that moving average, you move your stop to the low of that candle (shown by the blue stop line) and trail your stop along every crossing of the moving average until the trend changes and takes out your stop. So managing this trade is pretty easy...just wait for the stop lines to move and move your stop with them. It's a great way to trade when you can't be at your computer all the time because the stop orders take care of execution on both buy and sell side. If you use a daily timeframe for your moving averages (the default), you really only need to move stops around about once a day, so is a good part time trader's strategy in my opinion.
The best opportunities will come by scanning for stocks in the longer term timeframe of your moving averages. Wait for a consolidation on that timeframe so the anticipated breakout has some room to run. Once you've identified a good candidate, zoom in to your lower timeframe where the swing highs/lows will act as your entry and exit points, all while keeping the moving averages consistent between timeframes.
Hope you guys find it useful.
A few options available:
- Choose any timeframe for your moving averages, while using swing high/low points on intraday charts.
- Choose one of two moving averages shown for your trailing stops (default 10 and 20 MA).
- Choose to use the third moving average as a filter for keeping you out of trades that are below it (trading with the trend).
- Use the charts resolution candle or the moving average resolution candle for the moving average trailing stop.
- Only take trades where your buy level minus stop level is below a % of the Average Daily Range (ADR). This allows you to potentially have better risk/reward. I added a little table that shows the ADR of the stock/ticker as well as the range between the recent buy and sell levels (shown by the orange and blue horizontal lines) for easy reference.
